Context for Georgia’s Prison Admission Rate
by Niels Armbruster
Prison Admin Rates
The figure above depicts the prison admission rate in Georgia counties from 2006 to 2022. The
prison admission data was collected by the Georgia Department of Corrections
(https://gdc.ga.gov/Research/Annual_FY_profile_inmate_admissions), while population data for
each county was collected by the US Census Bureau (https://www.census.gov/data/tables/time-series/demo/popest/2010s-counties-total.html). From this, the prison admission rate proportion is calculated as the number of prisoners admitted from 2006 to 2022, who identified with a certain county over the population of that county from 2006 to 2022.
In the United States, counties play an important role in determining success in life, primarily
through the public education system. In Georgia, the state government assesses what they
think is the “local fair share” payment that the county should contribute to the public school
system, and then funds the rest from state and federal funds. Typically, this revenue is driven by
property taxes, meaning that affluent counties will have better-funded school systems. This is
evidenced through the graph above, with counties that score poorly in proportion of people
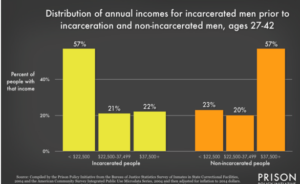
admitted to prison having a high level of residents below the poverty line. In a much broaderstudy, the Prison Policy Initiative demonstrates the impact that household income has on
incarceration rate (https://www.prisonpolicy.org/reports/income.html).
Additionally, the ACLU demonstrates a relationship between public school education systems and incarceration rates, as low funded public schools lead to overcrowded classrooms, which creates the school-to-prison pipeline (https://www.aclu.org/issues/juvenile-justice/juvenile-justice-school-prison-pipeline). With a public education funding system that benefits affluent counties, we clearly see income and quality of public school systems as cyclical causes of higher incarceration rates.
Lastly, we see a strong connection between unemployment and incarceration rate. According to the Prison Policy Initiative, we see that those incarcerated had a 60% average unemployment rate before being incarcerated, while the average for the US population is 10%(https://www.prisonpolicy.org/blog/2022/02/08/employment/#:~:text=High%20jobless%20rates%20precede%20incarceration%2C%20too&text=So%20while%20the%20overall%20US,by%20sex%2C%20race%20and%20ethnicity.).
*By Niels Armbruster
Niels is a rising junior at Emory University studying Economics and Mathematics, with prior experience with Common Good Atlanta in presenting a policy brief at the Georgia State Capitol to the Higher Education and Public Safety Committees as well as co-founding a peer mentorship program at Burruss Correctional Training Center (https://oxford.emory.edu/news/2022/04/students-visit-prisons-state-legislature.html).
* Map embedded by the coding expertise of David Evans, CGA alumnus